
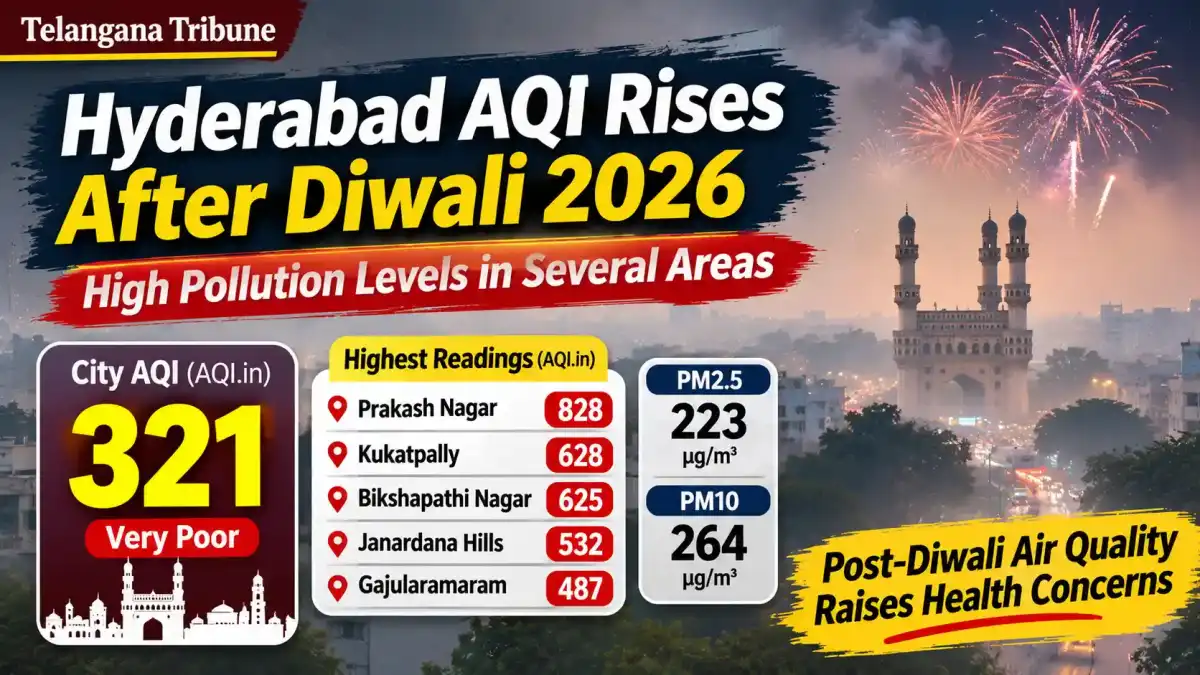
Hyderabad: Several parts of Hyderabad recorded high air pollution levels in the days following Diwali, with AQI.in reporting a city-level Air Quality Index (AQI) of 321 on November 8. Readings at some individual monitoring locations were significantly higher, crossing 600 in Kukatpally and Bikshapathi Nagar and reaching 828 at Prakash Nagar.
According to the AQI.in dashboard, Hyderabad’s reported PM2.5 concentration stood at 223 µg/m³, while PM10 was recorded at 264 µg/m³. The readings point to considerable variation in air quality across the city, with some localities recording much higher pollution levels than others.
Prakash Nagar Records AQI of 828
Prakash Nagar Station 2 topped the list of locations with an AQI reading of 828, followed by Kukatpally at 628 and Bikshapathi Nagar at 625. Janardana Hills also recorded a high reading of 532, according to the platform.
Other areas, including Gajularamaram, Pragathi Nagar and KPHB Phase 1, reported readings close to 500. In comparison, Kokapet Station 1, Upperpally and AWHO Colony recorded considerably lower figures.
Area-wise AQI readings
| Area / Monitoring Location | AQI |
|---|---|
| Prakash Nagar Station 2 | 828 |
| Kukatpally | 628 |
| Bikshapathi Nagar | 625 |
| Janardana Hills | 532 |
| Gajularamaram | 487 |
| Pragathi Nagar | 486 |
| KPHB Phase 1 | 486 |
| Serilingampalle M | 475 |
| Sundar Rao Nagar | 470 |
| Bachupally | 465 |
| Shirdi Sai Nagar | 450 |
| Chitrapuri Colony | 430 |
| Nallagandla | 423 |
| Manikonda (different monitoring points) | 324–362 |
| Kokapet Station 1 | 196 |
| Upperpally | 182 |
| AWHO Colony | 174 |
The figures are readings from individual monitoring points and do not represent a uniform AQI across each locality. They were reported on November 8 and may have changed since then.
Firecracker Smoke Adds to Pollution Concerns
Firecracker emissions are a source of particulate pollution during Diwali, while traffic, construction activity, road dust and industrial emissions contribute to Hyderabad’s existing air pollution. Weather conditions, particularly low wind speeds, can also affect the dispersal of pollutants.
However, the available readings do not establish how much of the pollution recorded in Hyderabad was directly caused by Diwali celebrations.
Residents Asked to Keep Track of Air Quality
High concentrations of fine particulate matter are a health concern, particularly for people with asthma and other respiratory or heart conditions. PM2.5 particles can penetrate deep into the lungs, while PM10 includes larger inhalable particles such as dust.
Residents can check the latest readings through the AQI.in Hyderabad air quality map. The IITM Air Quality Early Warning System also provides monitoring data for Hyderabad.
Note: The AQI.in figures in this report are time-specific readings reported on November 8, 2026. Individual monitoring-point readings should not be treated as the city’s overall average. Different monitoring platforms may report different values.


